Portfolio Changes & Economic Commentary for Q4 2021
Looking to 2022, focusing again on inflation & politics
Looking to 2022, inflation worries continue to dominate the conversation. The ongoing shipping issues that resulted from the COVID-19 pandemic continue to multiply across global supply chains, raising prices faster and for longer than most professional investors expected. These impacts are now being felt across the labor market: workers are striking and quitting their jobs at an accelerating rate. Eventually, wages will have to go up, which we hope will snap a long running divergence between worker productivity and wage growth. We’re already starting to see evidence that this is happening.
As we already positioned the portfolios to account for increased inflation and the possibility that the Federal Reserve will raise interest rates earlier than expected, we don’t have major revisions this quarter. We have continued our ongoing monitoring, and have a replacement for an underperforming small company fund to make, a new fund to add to our most aggressive portfolio, and an addition from last quarter that will now be applied to all of our accounts. Here are the highlights, and you can view the more in-depth analysis below:
- Last quarter, following the news that The Calvert Emerging Markets Equity Fund (CVMIX) closed to new investors, we set the Matthews Asia ESG Fund (MISFX) as the primary investment vehicle targeting the Asian markets for new investors. In September, CVMIX had a manager change for the first time since 2012, and the longtime co-manager stepped down months later. The lead manager on the fund is inexperienced and with the change, the fund went from a consistently good performing fund (which has, according to Morningstar (email us for a full report), been in the top two quartiles of its’ peer group since 2017) , to a bottom performing fund this year. As such, we are removing its’ status as an ‘alternate’ in our portfolios for current clients. If you own CVMIX in your account, we will be selling it in favor of MISFX.
-
This post is intended as a generic report on the changes we are making to our models. Our portfolio management techniques are designed to put us in control of the implications of trading, so if you would like an estimate of the tax consequences of these changes, please call us and we can discuss your individual situation and the implications both of making these changes and of holding off on them.
-
If we have discretion on your account, we will implement changes and rebalance your account in the next week unless we hear from you to the contrary.
-
- In our aggressive portfolio, we are beginning a relationship with a new asset manager, Baillie Gifford. Baillie Gifford is an institutional asset manager based out of Scotland. Their Positive Change Equities Fund recently hit its’ 3 year track record, and boasts some truly impressive results. While past performance is never a guarantee of future performance, we have been engaging with them to learn more about their process (which you can read about here) and how they approach creating impact in the public markets (which you can read about here). As this is an aggressive growth fund, we are adding it only to our most aggressive portfolio for now. We anticipate that it may be added to our Moderate Aggressive model in the future, as the fund has so far exhibited characteristics that would make it a good fit for this model as well, but we need to get more familiar with the fund for now, so we are only adding it to the most aggressive portfolio.
- After the feedback on last quarter’s sustainability reports from YourStake.org, we are pleased to share a different version of their reports! This quarter, we’re pleased to present ‘metaphor’ style reports that show the impacts of investing in our portfolios compared to the broader markets in real terms. Please click here to take a questionnaire if you’d like us to run you a custom impact report.
Stats and Charts for Nerds
This is the part where we go a bit numbers crazy – This will be written in more technical language, and will show direct sourcing of data with analysis.
Interest Rate Forecasts
The OECD Long Term Interest Rate Forecast is beginning to show a spike, although this consensus forecast remains well below pre-pandemic levels. Click the OECD logo in the image below if you’d like to play with the data yourself.
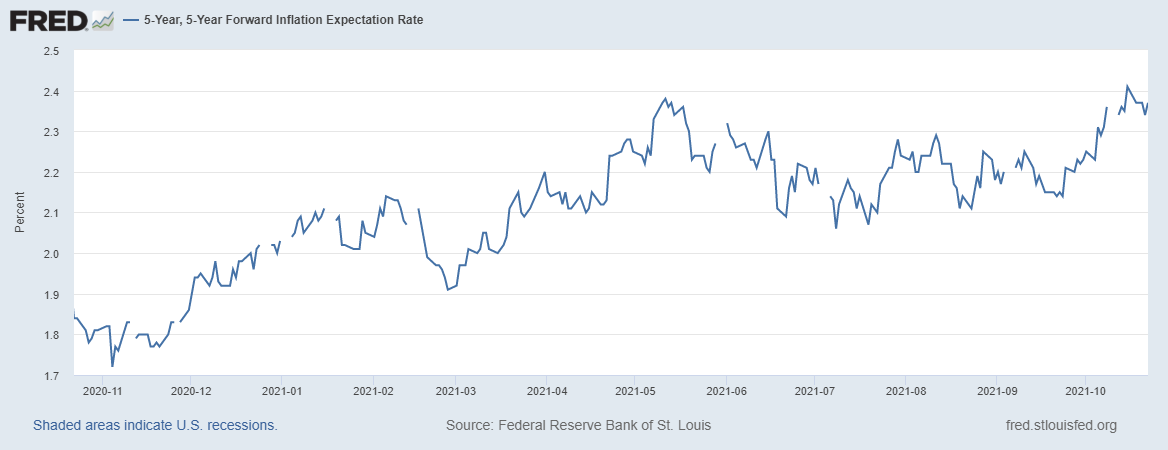
While the Federal Reserve’s ‘5 year, 5 year forward’ inflation expectation rate moved from 2.21 at the end of July to 2.27 at the beginning of October, before jumping to 2.37 by the end of the month. We don’t typically talk about metrics this ‘wonky’, but this measures expected inflation (on average, measured by a survey of economists – here’s more reading) over the five-year period that begins five years from today.
Cash on the sidelines
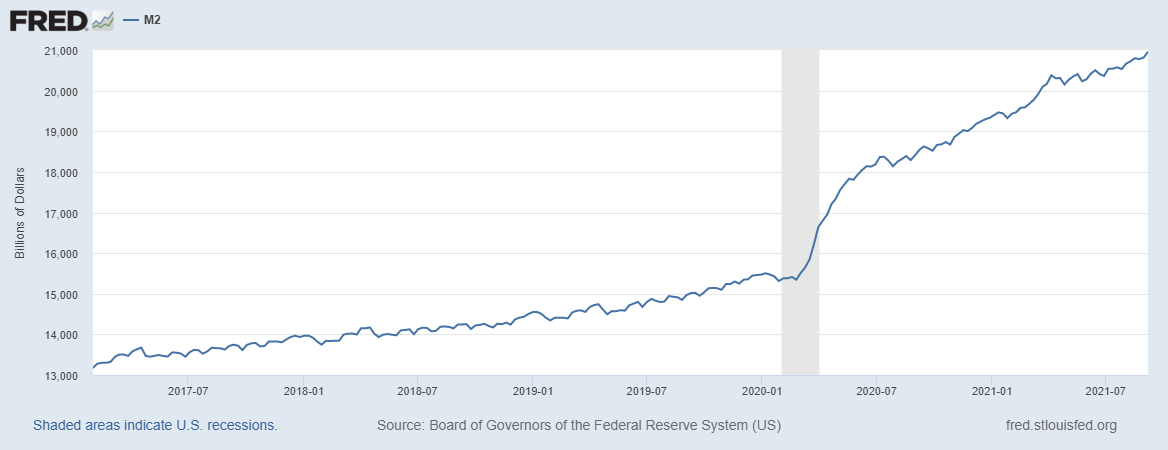
The M2 Money Supply, a constant topic for the ‘stats for nerds’ section of this post, is a broad measure of how much cash is sitting on the sidelines. As this measure includes the cash in savings accounts, money markets and mutual funds, it’s our preferred measure of how much cash investors have to deploy into the markets. This chart shows that the rate of growth has continued to increase at a faster rate then pre-pandemic, which tells us to expect more investors employing a ‘buy on the dip’ strategy, which we hope will dampen some of the volatility in the markets over the next few months.
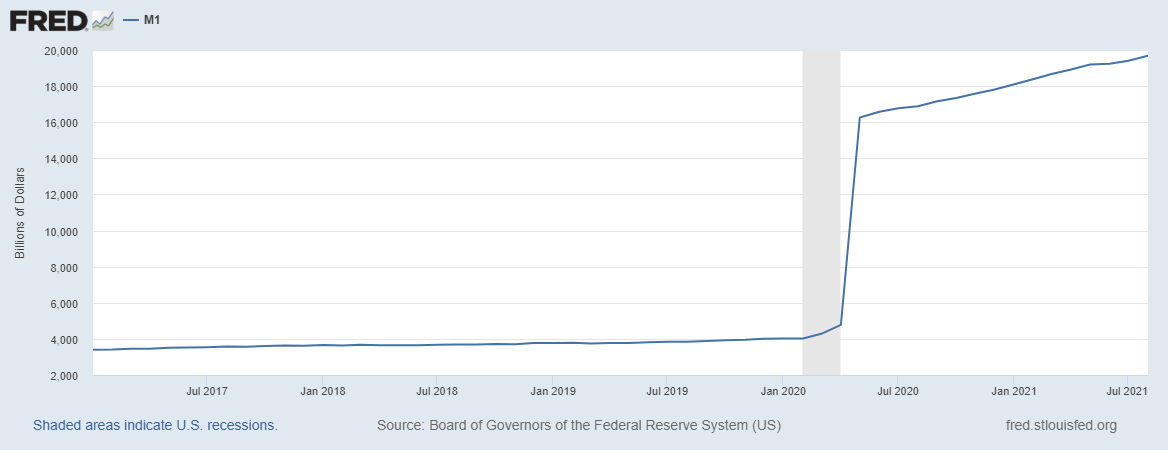
This is in contrast to the M1 Money Supply, which just looks at physical currency, and the cash in checking (but not savings) accounts. While this has continued to grow (also at a faster rate than pre-pandemic), the growth of M2 appears faster than the growth of M1, which tells us that it is, in fact, investors and savings accounts that are seeing the largest share of growth.
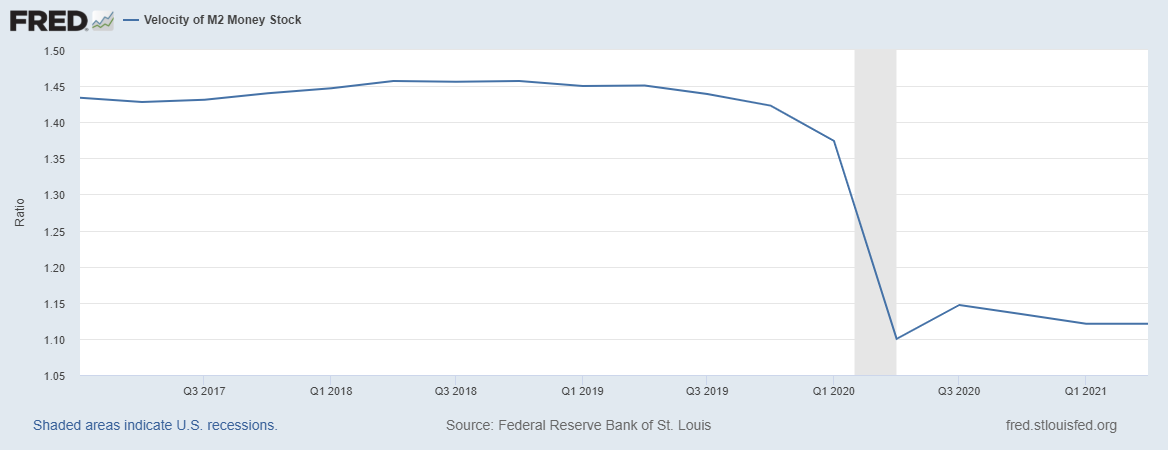
The last piece of this puzzle is the velocity of money. This measures (roughly) how quickly money is changing hands (here’s why this is important). Unsurprisingly, this chart is the inverse of the charts above. This is concerning because we’re seeing inflation while the velocity of money is still extremely low. In these terms, the burst of pent-up demand we expected at the end of the pandemic has yet to fully hit, meaning that even once the supply chain induced inflation we’re currently seeing ends, we could still be in for an extended period of inflation based on increased consumer spending.
Corporate Earnings are encouraging
Here’s a link to some raw data from FactSet, which looks at the current earnings season. Highlights from this report (which is a partial report on earnings season, which is still in progress as of this writing) include:
- 84% of S&P 500 companies have beaten expectations in terms of earnings/share, and 75% have beaten expectations on raw earnings.
- This quarter represents the highest earnings growth rate since 2010 (32.7%, which is an impressive number).
- Companies with more international revenue posted faster earnings growth than companies with more US only revenue.
- This is significant, and in our opinion represents a potential reversal of a longer term trend where US equities were the driver of growth in our portfolios. We’ve been underweight international equities for a while now, and are beginning to look for opportunities to increase our international exposure. Expect us to take an approach consistent with the risk level of each model, adding in more international exposure to the most aggressive portfolio and waiting to increase our exposure to the lower risk portfolios as we wait for the trend to solidify.
Politics
We try to resist the urge to do political commentary here, or to politicize the markets, but there are a number of things worth watching from Washington, and this week from Glasgow.
- As sustainable investors, we’ve been in conversations with our partners about the upcoming COP26 Climate Summit. Here’s a good piece of reading on this event.
- There’s a new report out of the Financial Stability Oversight Board that looks at the systemic risks to the financial system from climate issues, which underscores our beliefs in managing the sustainability profile of our portfolios. Here’s a good explainer. (Here’s a link to the report itself if you want to read it)
- Tied in with this conversation is the massive spending package which is key to the current administration’s climate priorities. Things are not looking good on that front at the moment.
Student Loans (no intimidating stats here, we promise!)
We’ve already written about this topic at length elsewhere on our blog, but we REALLY want you to see this in case it applies to you. There is a HUGE change to the Public Service Loan Forgiveness program in the works, and it impacts everyone who has federal student loans and works in the public service. The NY Times has a great explainer (this link will go through their paywall) and you can read what we’ve written on this topic here. As usual, we’ll encourage you to get in touch with us about how this impacts your situation.
Portfolio Changes
Please click the buttons below to see the changes to each model, or click into the areas below for more information.
On the last page of each report is an “Action Plan” that shows our Buy, Hold and Sell recommendations.
In addition to these changes, we will rebalance all accounts to bring them into alignment with the models.
All model portfolios are presented at a $100,000 value, & all performance numbers are quoted net of a 1% management fee.
Let us know what you think about the new Impact Metaphor Reports!

